How to access
- Click the LiveChat icon in the left sidebar of your Tars dashboard.
- In the left panel, click Analytics. You’ll find seven sub-sections: Overview, Conversations, Agents, Inboxes, Labels, CSAT, and Transcript.
1. Overview
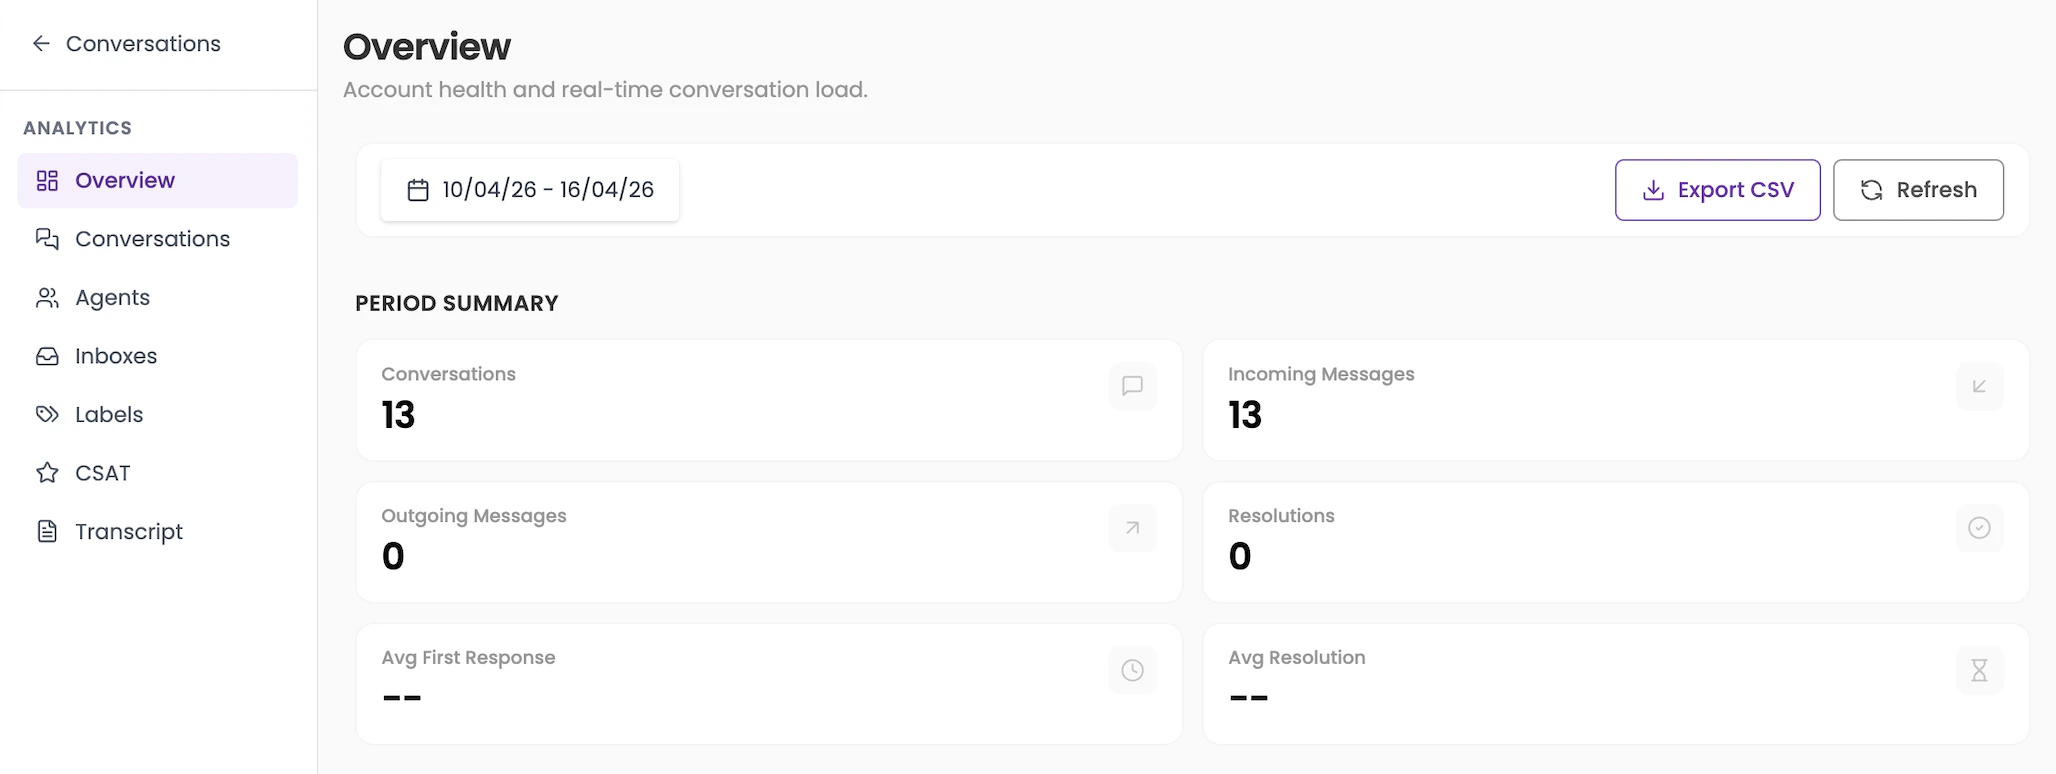
Account health and real-time conversation load. The Overview page gives you a snapshot of your LiveChat activity for the selected date range, plus a live view of what’s happening right now.Period summary
| Metric | What it shows |
|---|---|
| Conversations | Total number of conversations started in the selected period |
| Incoming Messages | Total messages received from customers |
| Outgoing Messages | Total messages sent by agents |
| Resolutions | Number of conversations marked as resolved |
| Avg First Response | Average time taken by an agent to send the first reply |
| Avg Resolution | Average time taken to resolve a conversation |
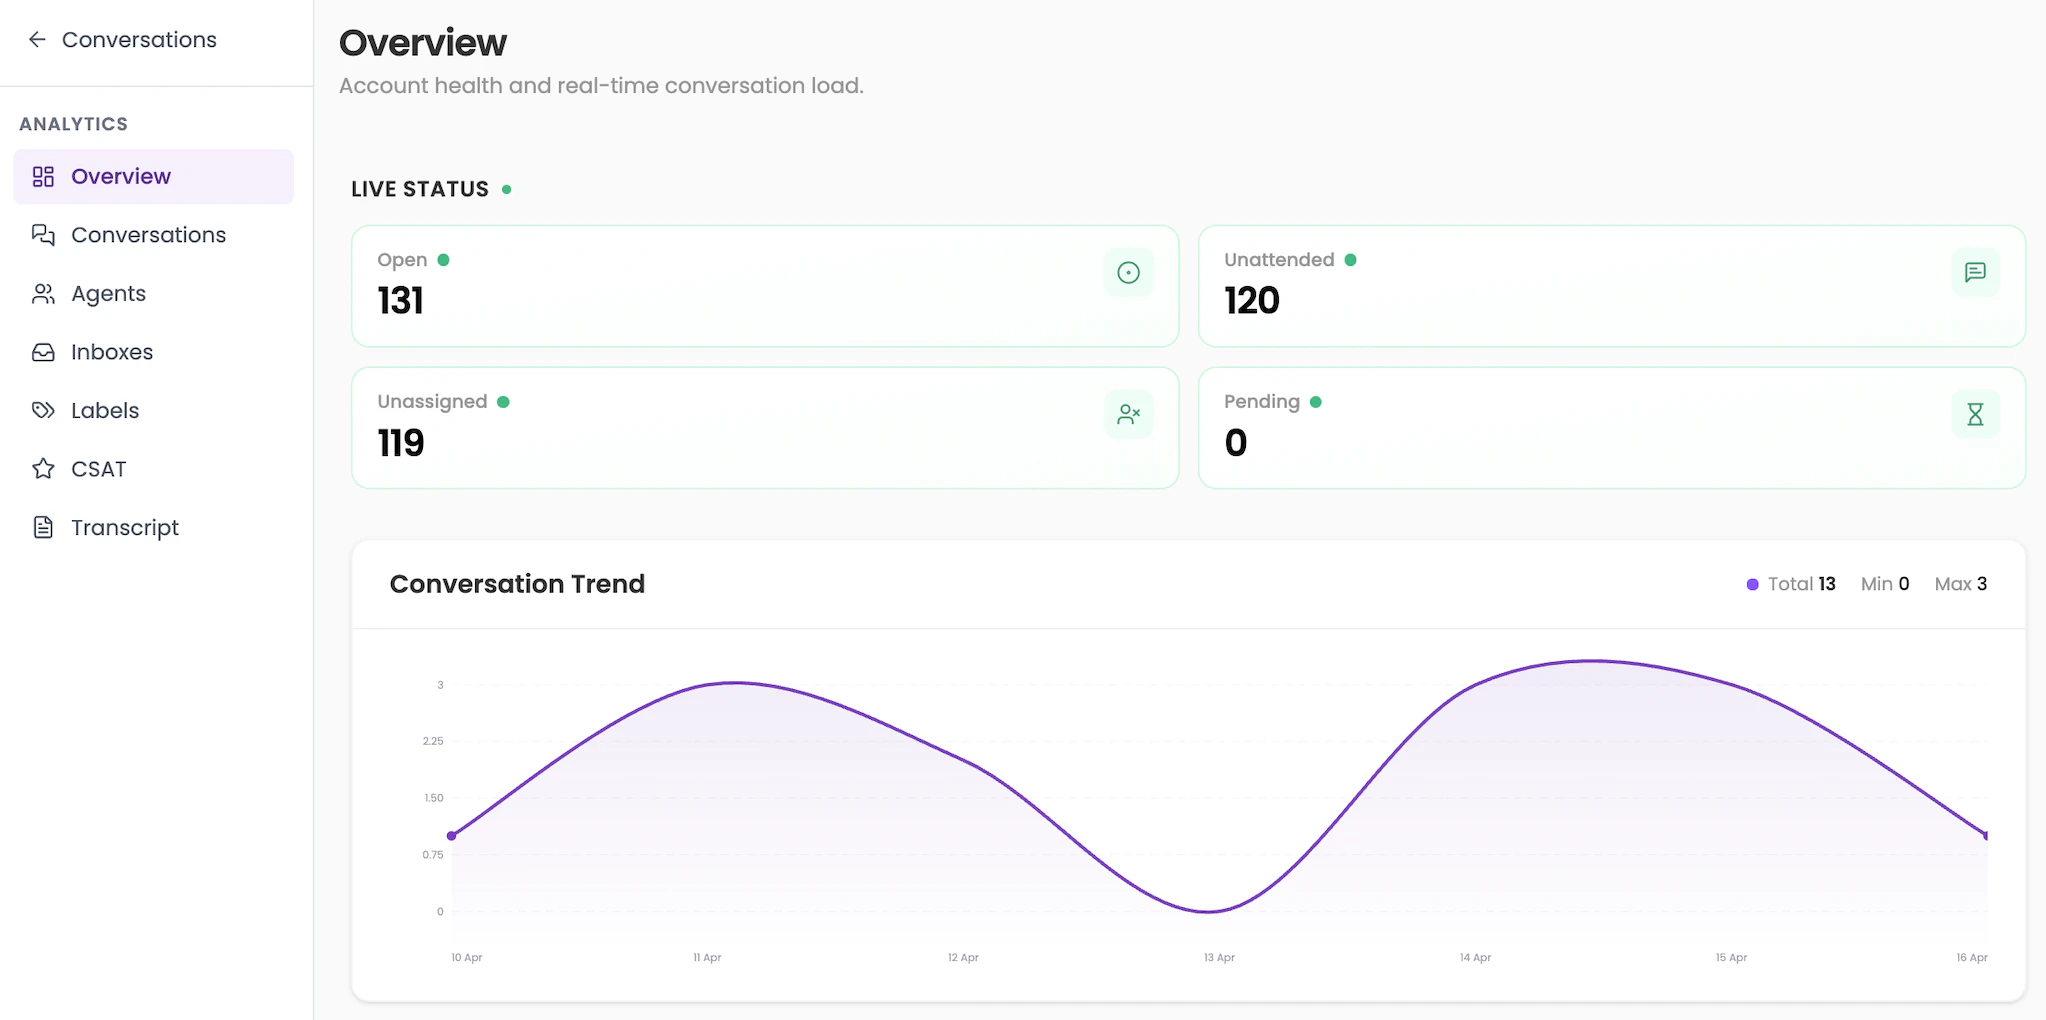
Live status
These update in real time and are not affected by the date filter.| Status | What it shows |
|---|---|
| Open | Conversations currently open and active |
| Unattended | Open conversations that have not received an agent reply yet |
| Unassigned | Open conversations not yet assigned to any agent |
| Pending | Conversations waiting on a response or action |
2. Conversations
Track conversation trends and agent conversation load. This page breaks down conversation activity for the period and shows how the load is distributed across agents. Top metrics (live):- Open — Total currently open conversations
- Unattended — Open conversations with no agent reply
- Unassigned — Open conversations not yet assigned
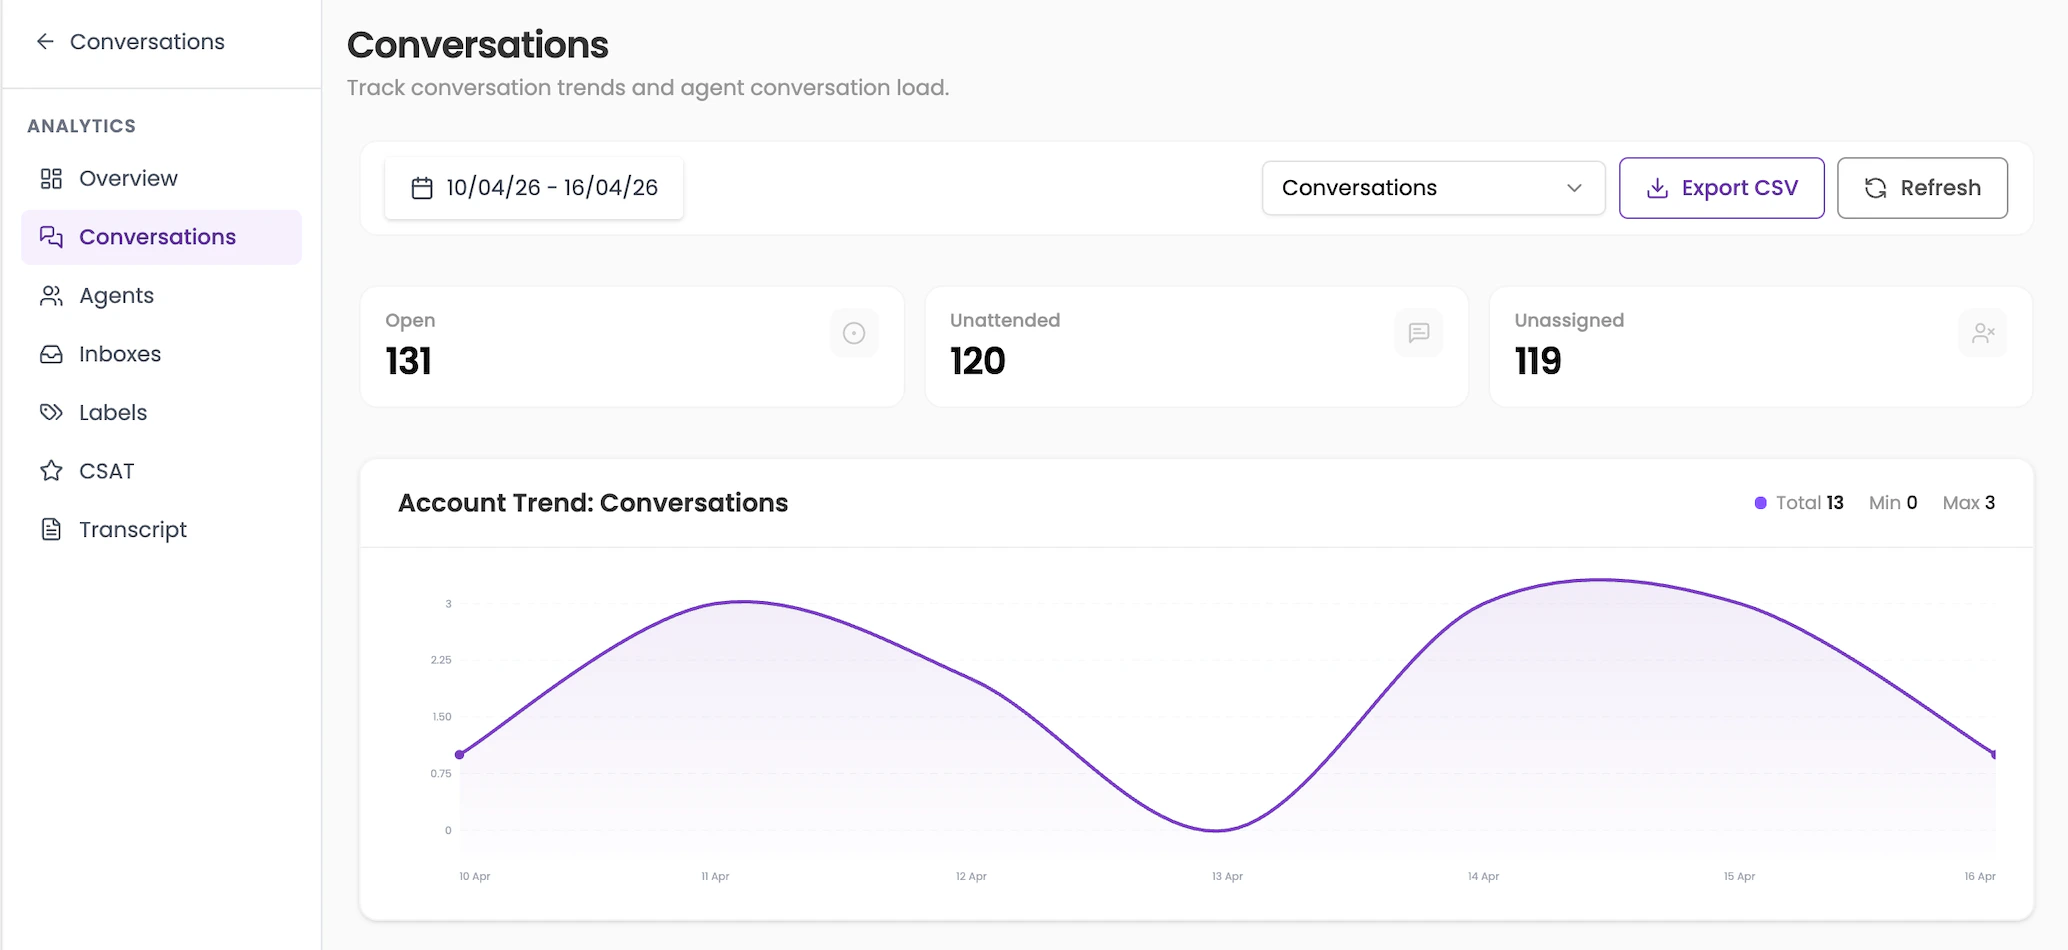
The metric counts at the top of this page reflect live data, not the selected date range.
3. Agents
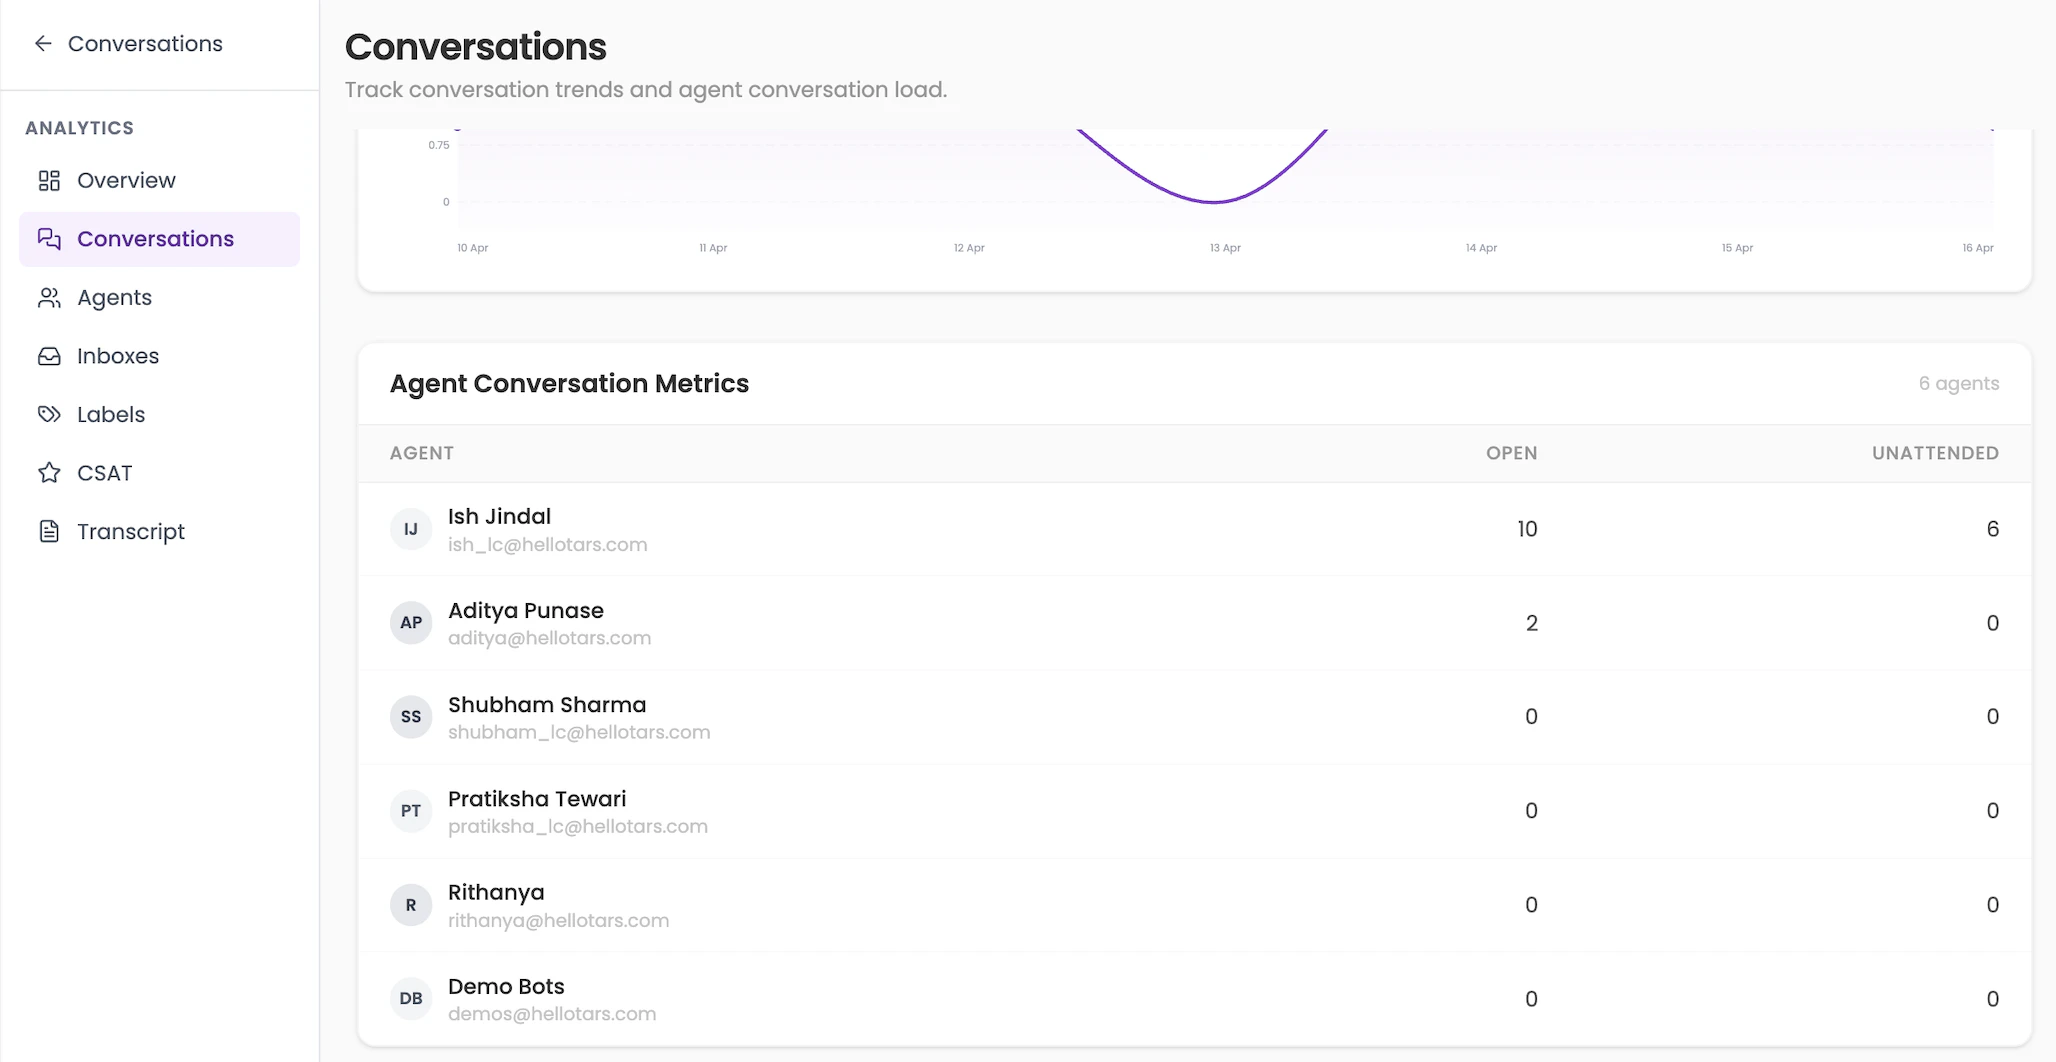
Conversation and response performance by agent. This page shows how each agent is performing across key metrics for the selected period.Agent table columns
| Column | What it shows |
|---|---|
| Conversations | Total conversations handled by the agent |
| Resolved | Number of conversations the agent resolved |
| Avg First Response | Average time for the agent’s first reply |
| Avg Resolution | Average time for the agent to resolve a conversation |
| Avg Reply | Average time between agent replies in a conversation |
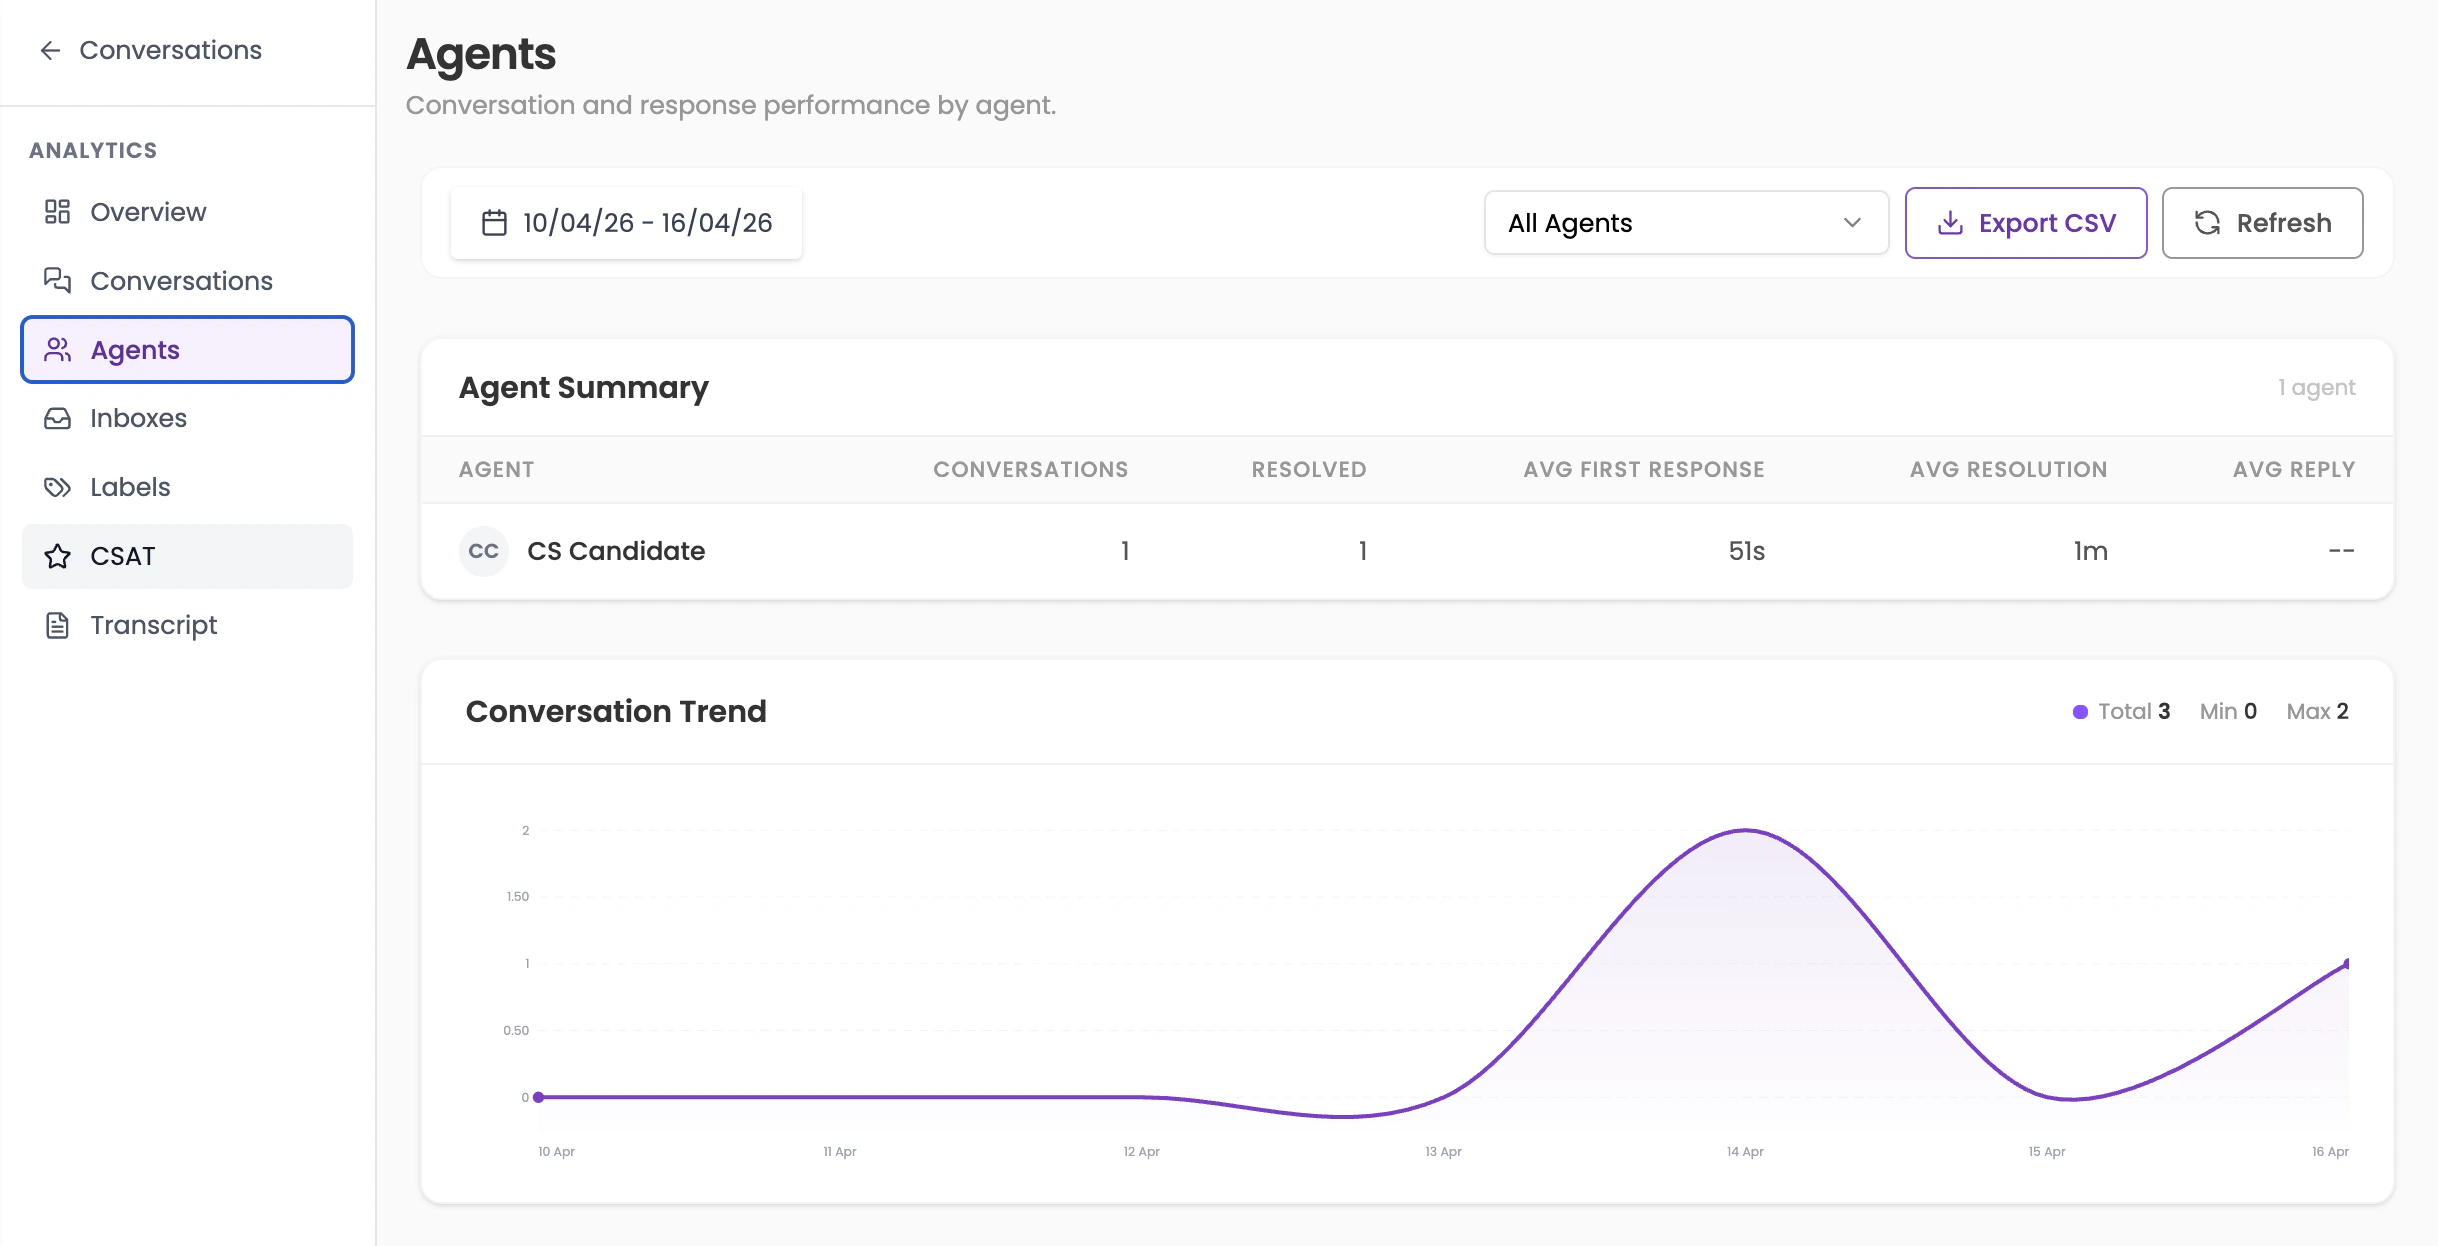
If a column shows
--, it means there is not enough data to calculate that metric for the selected period.4. Inboxes
Team inbox performance and conversation trend. This page shows performance broken down by each inbox (e.g. Website Inbox, Support Inbox).Inbox summary table columns
| Column | What it shows |
|---|---|
| Inbox | Name of the inbox |
| Conversations | Total conversations received in that inbox |
| Resolved | Number of conversations resolved |
| Avg First Response | Average first response time for that inbox |
| Avg Resolution | Average resolution time |
| Avg Reply | Average reply time |
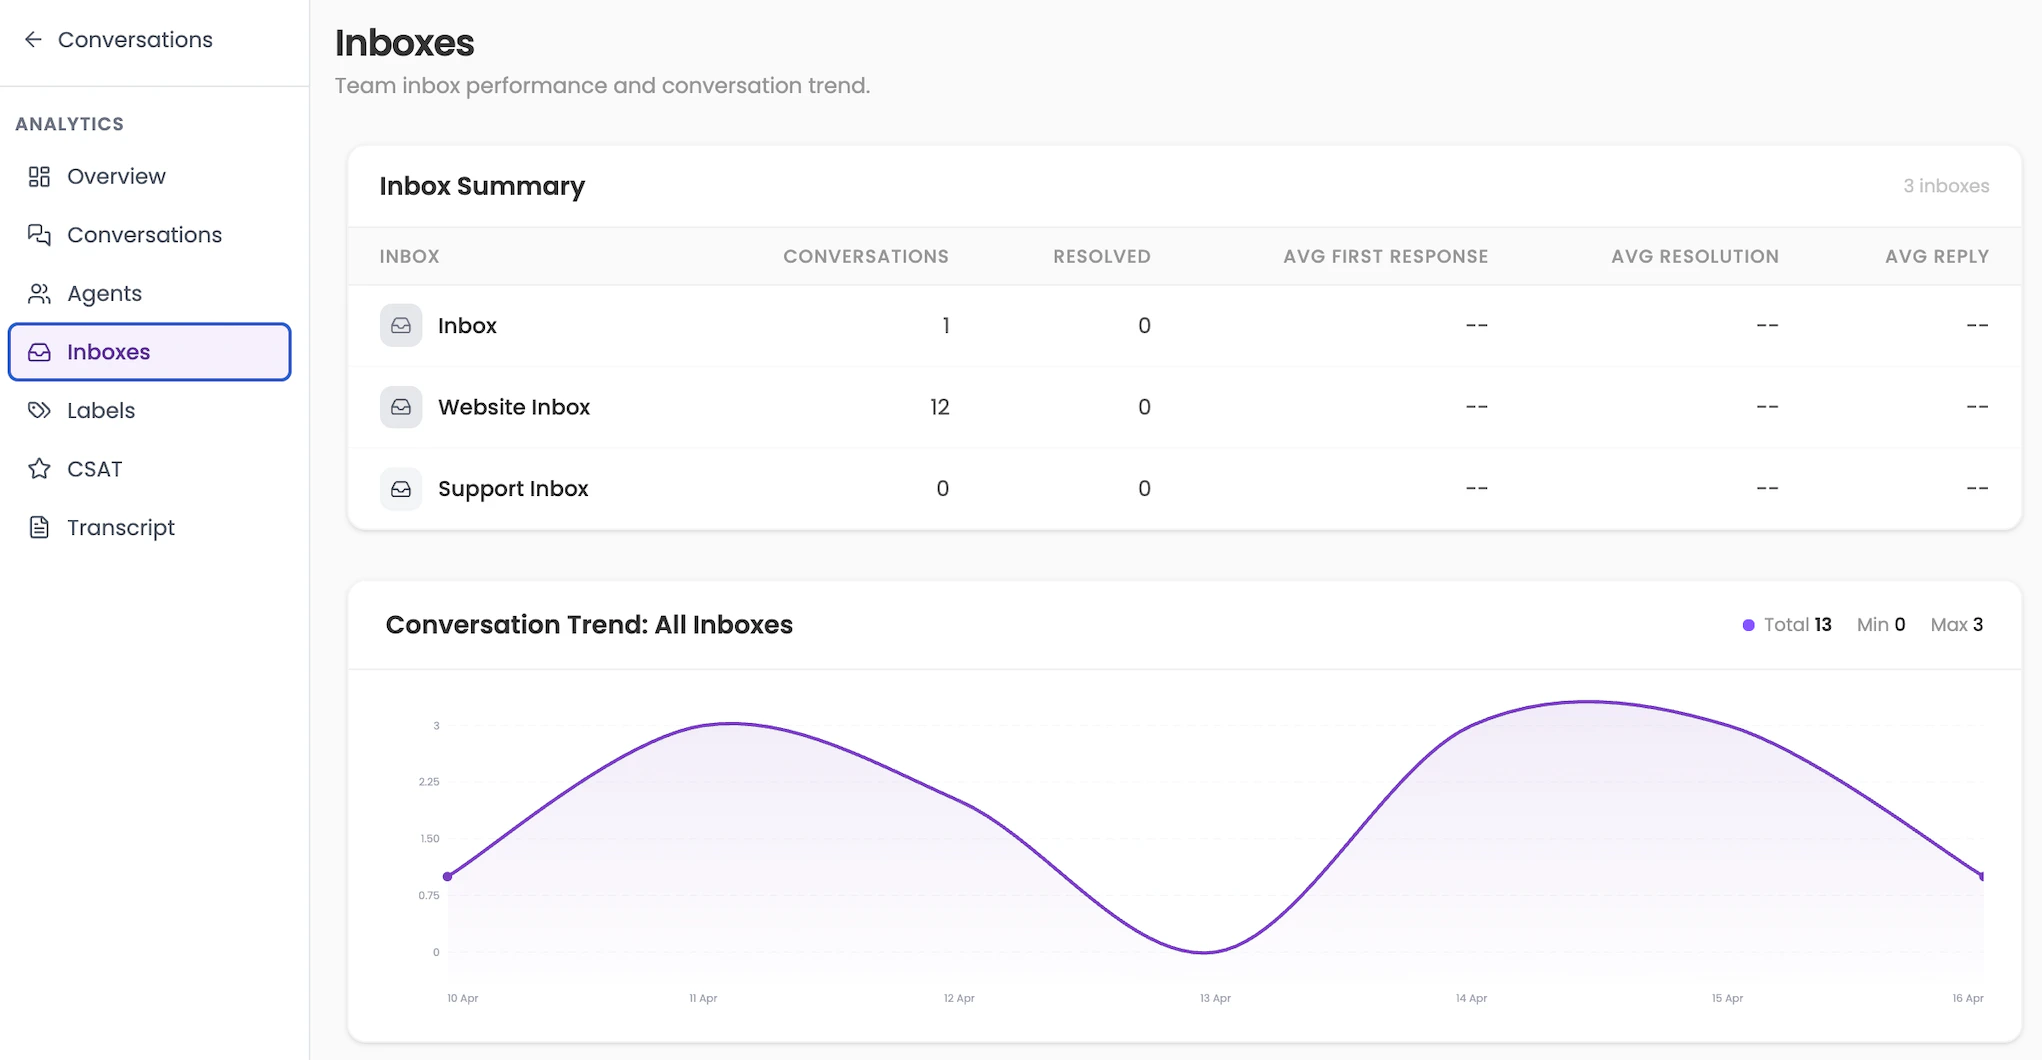
Use this page to compare inbox performance and identify which channel (e.g. website vs support) is driving the most volume.
5. Labels
Performance metrics for labeled conversations. If your team uses labels to categorise conversations (e.g. “billing”, “junk”, “urgent”), this page lets you filter analytics by a specific label. Use the label dropdown at the top to select the label you want to analyse. The metrics shown are identical to the Overview period summary: Conversations, Incoming Messages, Outgoing Messages, Resolutions, Avg First Response, and Avg Resolution. Conversation Trend — Shows volume over time for conversations tagged with the selected label.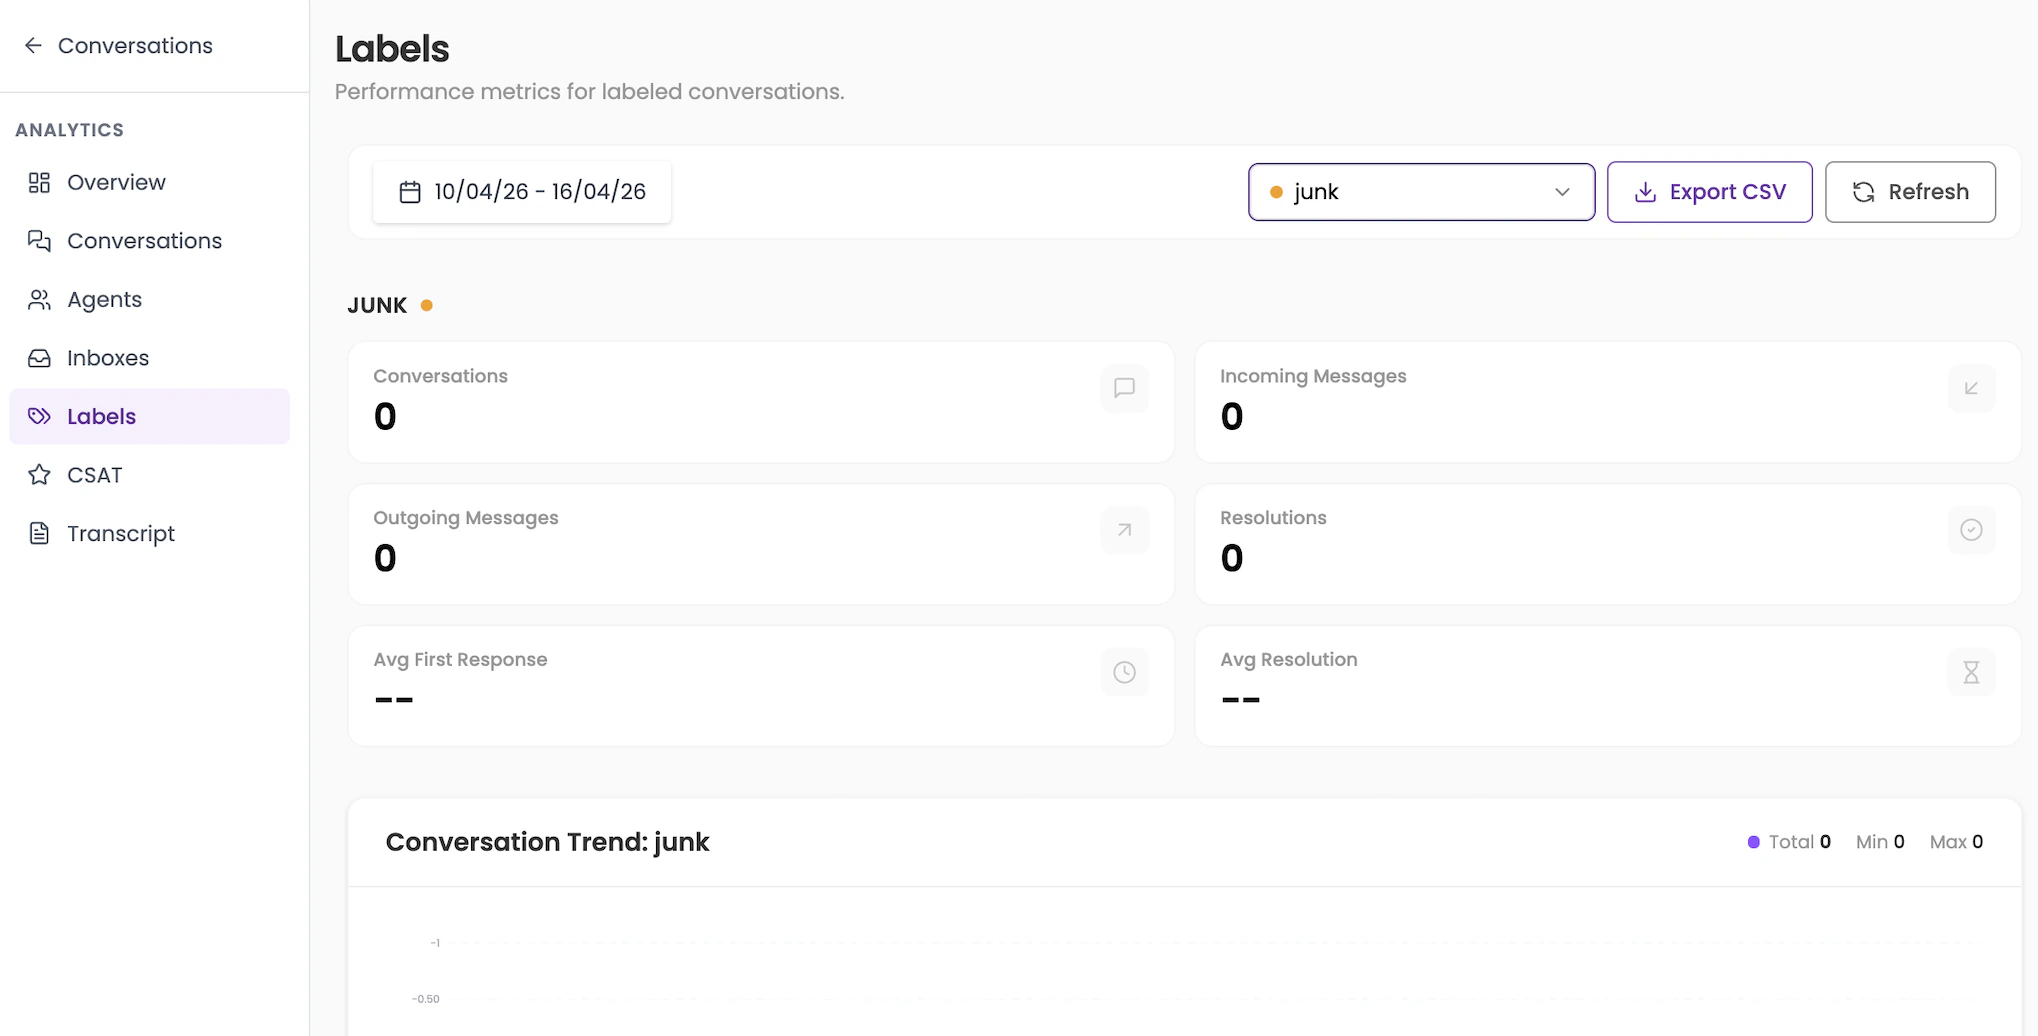
If no conversations are tagged with a label in the selected period, all metrics will show 0.
6. CSAT
Customer satisfaction response analytics and feedback. CSAT (Customer Satisfaction) tracks how customers rate their conversations after they are resolved.Top metrics
| Metric | What it shows |
|---|---|
| CSAT Responses | Number of customers who submitted a rating |
| CSAT Surveys Sent | Total number of CSAT surveys sent out |
| Response Rate | Percentage of surveys that received a response |
| Positive Ratings (4–5) | Number of responses rated 4 or 5 stars |
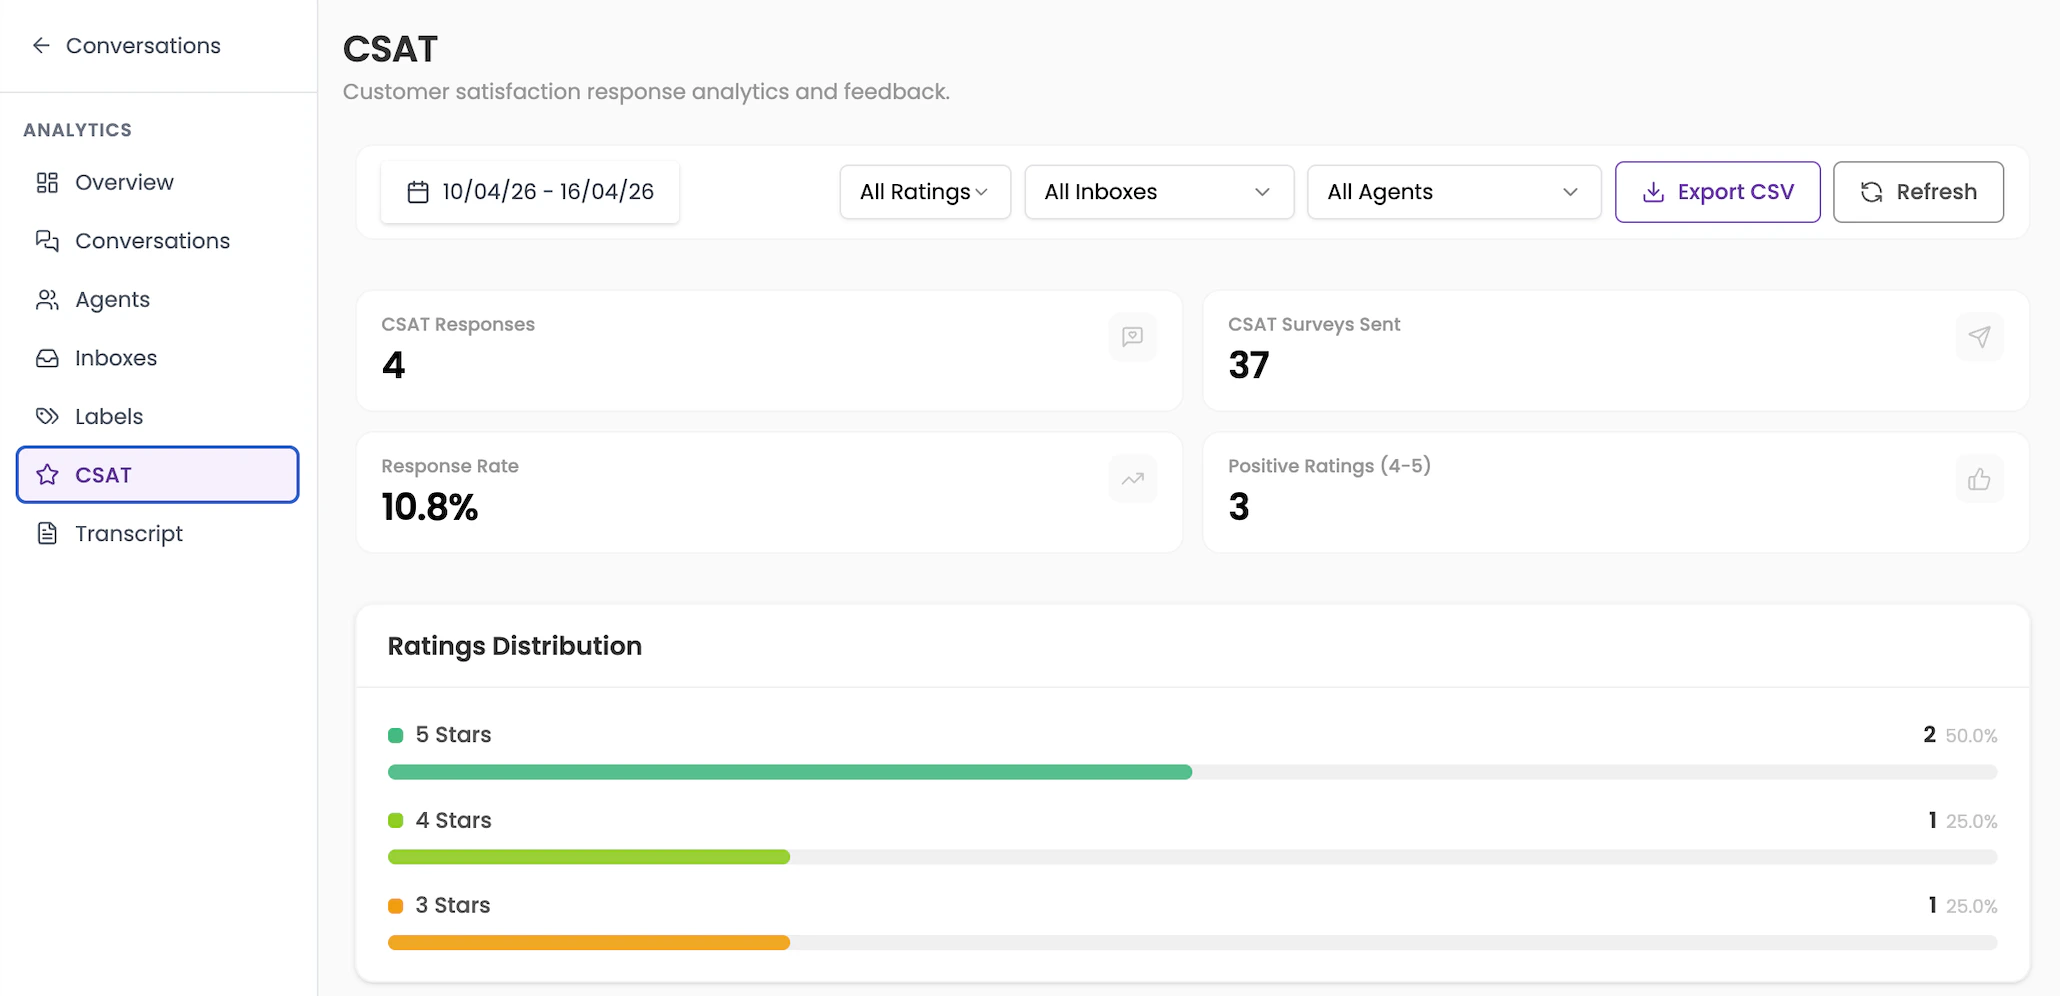
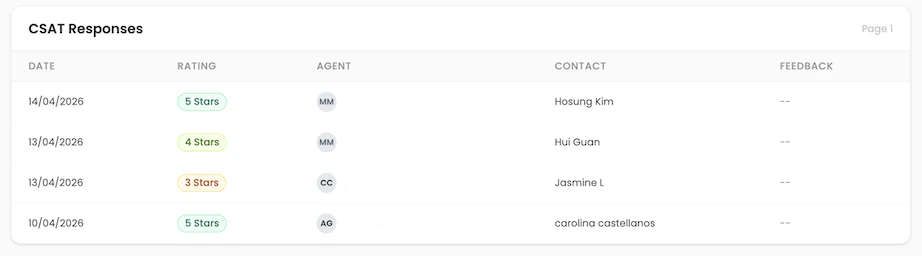
Export the CSAT data as a CSV for deeper analysis or to share with your team in a report.
7. Transcript
Export livechat conversation transcripts for a selected date range. This page lets you export a full record of conversations as a CSV file. How to export:- Set the date range using the date picker.
- Click Export Transcript CSV.
- A CSV file will download containing all conversation transcripts for that period.
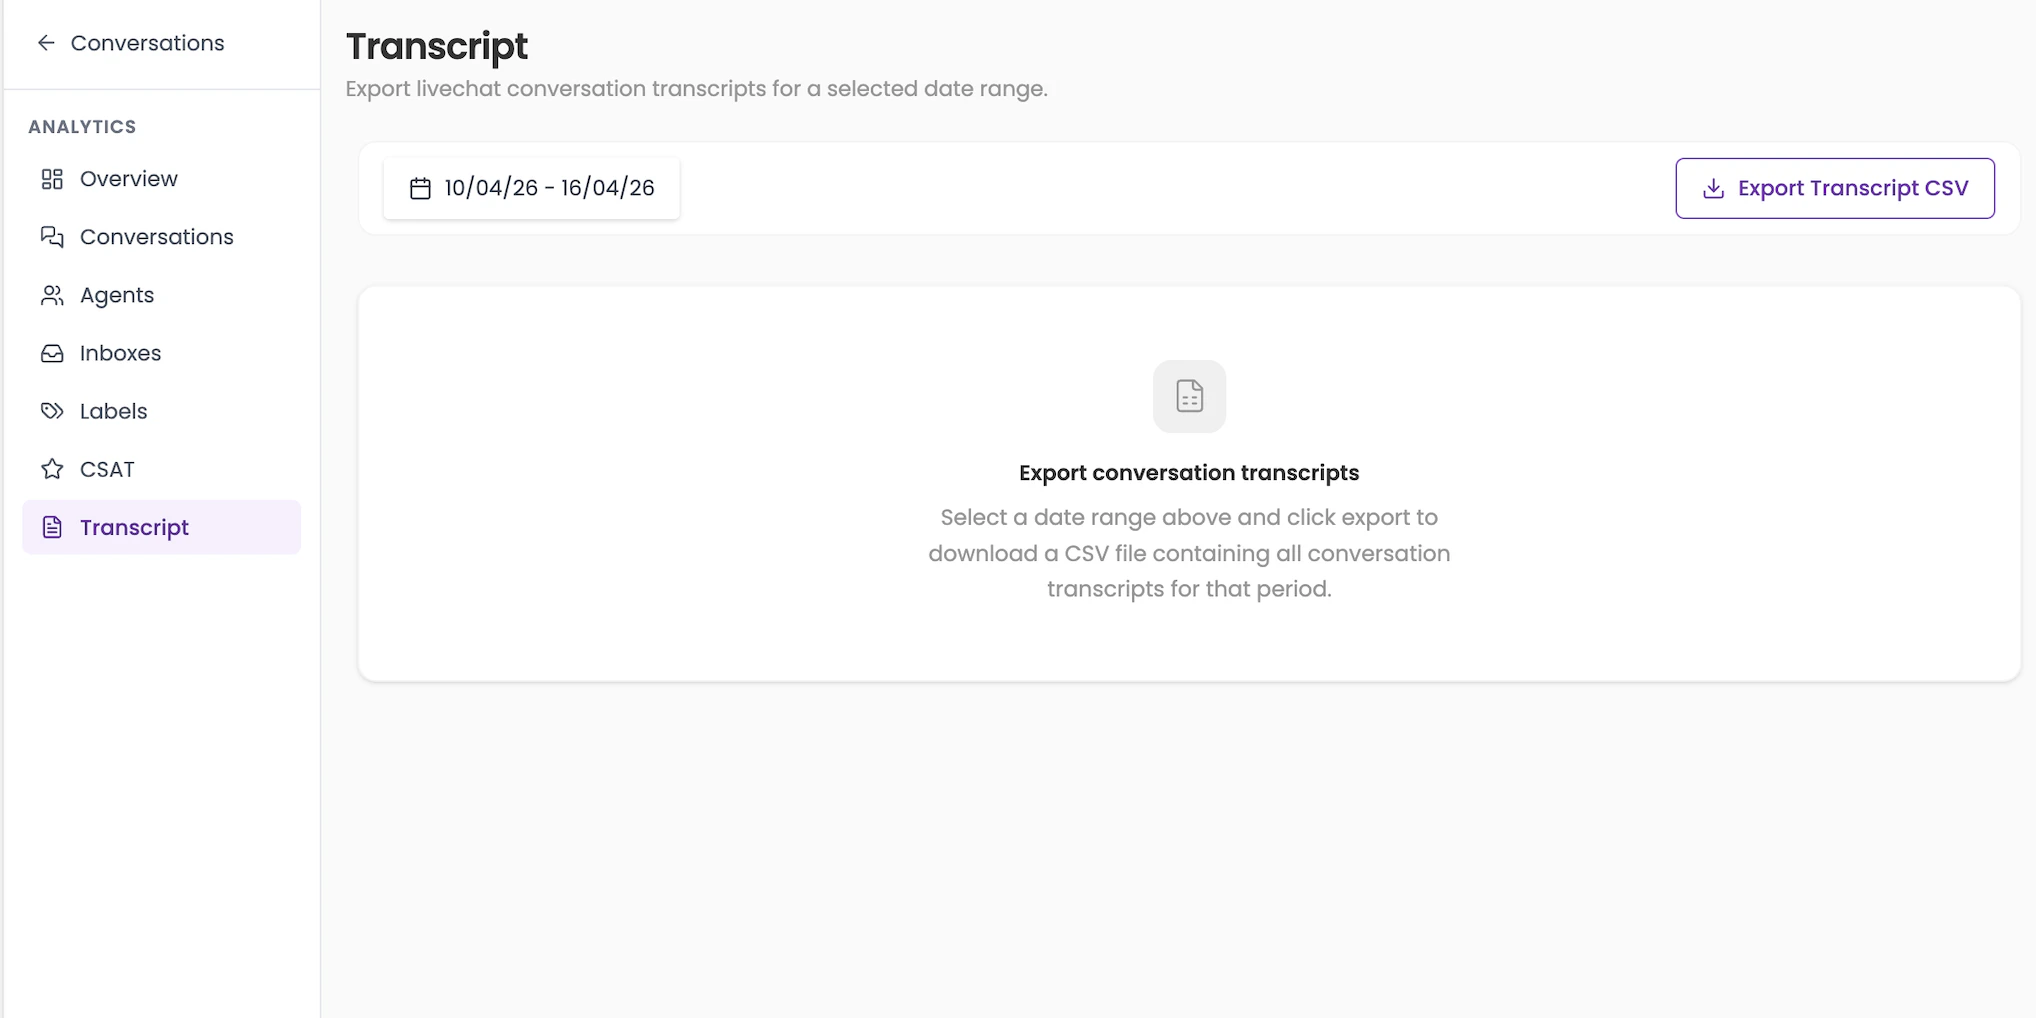
The exported CSV includes the full message history for each conversation — useful for audits, quality reviews, or training purposes.
Frequently asked questions
Can I export analytics data?
Can I export analytics data?
Yes. The CSAT section has a CSV export option. The Transcript section lets you export full conversation histories. For other sections, you can use the date range filters and take screenshots or manually record the data.
Why do some agent metrics show '--'?
Why do some agent metrics show '--'?
This means there is not enough data to calculate that metric for the selected period. Try expanding the date range to get more data points.
What is the difference between Open, Unattended, and Unassigned?
What is the difference between Open, Unattended, and Unassigned?
Open means the conversation is active. Unattended means it’s open but no agent has replied yet. Unassigned means no agent has been assigned to it at all. A conversation can be both unattended and unassigned at the same time.